Peak vs RMS Meters in Live Sound: Reading Level Correctly
7 min read · Updated September 21, 2026 · FOH and monitor engineers, live sound beginners, venue technicians, production managers, and working bands
Learn the difference between peak and RMS-style audio meters, how crest factor and meter position affect readings, and how to verify live sound gain and handoffs.
TL;DR — A peak meter emphasizes short signal maxima that may clip a stage, while an RMS-style or average meter represents sustained energy more closely. Their numbers are not interchangeable: ballistics, calibration, scale, reference, and meter position all matter. Use peak indication to protect headroom, average indication to understand sustained level, listen for the actual problem, trace the first wrong stage, and document the meter, tap point, signal, reference, and test condition.
Table of contents
- Define peak and RMS-style metering
- Read crest factor
- Choose the useful meter
- Trace meters through the signal path
- Run and document a level check
- FAQ
Define peak and RMS-style metering
A peak meter responds to the highest short-duration signal values within its detection window. It is useful for finding transient overload risk in a preamp, converter, processor, bus, output, recorder, or transmitter. A sample-peak meter and a true-peak meter are not identical; true-peak estimation is designed to reveal possible inter-sample peaks in a reconstructed digital signal.
An RMS-style meter applies averaging intended to relate more closely to sustained signal energy. Consoles may instead label a display average, VU, loudness, or use proprietary ballistics. Those measurements are related but not equivalent. Read the device documentation before comparing values.
| Display | Emphasizes | Useful for | Does not prove |
|---|---|---|---|
| Sample peak | Highest digital samples | Digital headroom inside a stage | True-peak level or perceived loudness |
| True peak | Estimated reconstructed peaks | Delivery and conversion margin | Musical balance or safe audience SPL |
| RMS / average | Sustained electrical signal energy | Comparing ongoing program level | Short transient margin |
| VU-style | Calibrated average with defined ballistics | Nominal operating level | Instantaneous peaks |
| Loudness metric | Weighted level over a defined time | Broadcast or streaming program consistency | Hardware headroom at every stage |
These are electrical or digital signal meters. An SPL meter measures acoustic pressure with its own weighting and time response.
Read crest factor
Crest factor is the difference between a signal's peak level and its average or RMS-style level, expressed in decibels when the references match. A snare hit, uncompressed vocal, speech, and heavily limited playback can have very different crest factors even when one average meter looks similar.
High crest factor means brief peaks sit well above the sustained level. Low crest factor means peaks and average are closer together. Neither is automatically better. The expected program and processing determine the margin required.
For example, two sources can share the same peak while one has a much lower average, or share the same average while one produces higher transients. That is why one display cannot describe both clipping risk and sustained energy.
Do not infer loudspeaker safety from crest factor alone. Amplifier limits, thermal behavior, processing, impedance, frequency content, duration, calibration, and manufacturer design also matter. See the PA headroom guide for the full system boundary.
Choose the useful meter
Protect a digital or analog stage
Use the meter that exposes overload at that stage. Peak and clip indicators are primary when checking a preamp, converter, plug-in, bus, output, recorder, or transmitter for short overloads. Confirm whether the clip light latches and where its detector sits.
Establish nominal operating level
An average or VU-style display can help place sustained program near a documented operating reference while leaving peak margin. “Zero” may mean digital full scale, a nominal analog reference, unity gain, or a chosen alignment point. Never assume scales match between devices.
Compare program consistency
Use the defined RMS, average, or loudness metric required by the destination. A stream specification, recorder input, broadcast feed, and PA processor may use different references. Do not chase a streaming loudness target on a console meter that does not implement that metric.
Set dynamics processing
Watch the processor's detector and gain-reduction displays as well as input and output meters. Peak or RMS detector modes change how a compressor responds; they do not turn its output meter into proof that the next stage has headroom.
Trace meters through the signal path
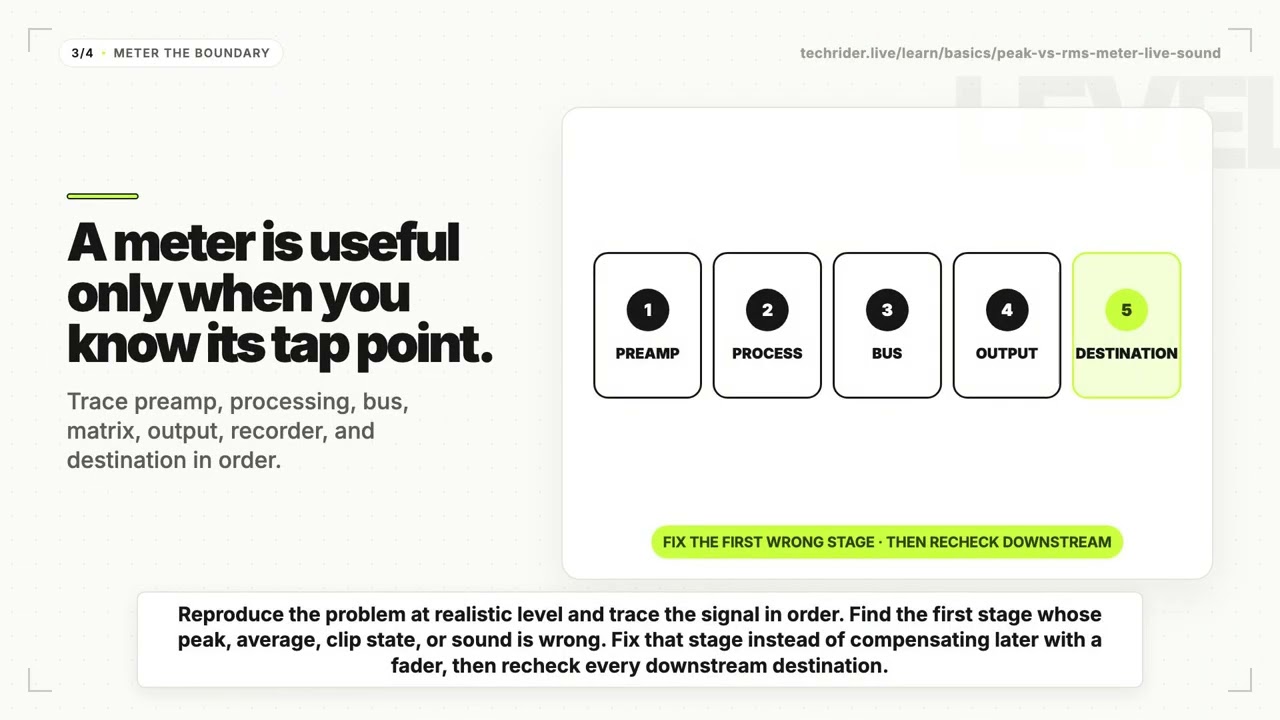
A meter is meaningful only when its tap point is known. A channel meter may be preamp, pre-EQ, post-EQ, pre-fader, post-fader, or post-mute. Bus and output meters may appear before or after processing and delay. The recorded or network signal may leave at another point entirely.
Use this sequence when readings disagree:
- Reproduce the issue with representative program level.
- Start at the source output and inspect the first available input meter.
- Follow the signal through preamp, converter, processing, fader, bus, matrix, output, interface, and destination.
- Identify the first stage whose peak, average, clip state, or sound is wrong.
- Fix that stage instead of compensating later with a fader.
- Recheck every downstream destination after the change.
This extends the gain-staging workflow: a healthy channel meter does not guarantee that summed buses or outputs are healthy.
Run and document a level check
- Define the source, destination, expected performance range, and responsible operator.
- Record the console, firmware, meter type, scale, reference, and tap point.
- Bypass unknown inherited processing and begin with outputs controlled.
- Have the performer or playback source produce realistic quiet, normal, and maximum material.
- Watch peak and average behavior together where available.
- Leave margin for source variation, channel summing, EQ boosts, and downstream processing.
- Check buses, matrices, physical outputs, recording, stream, and monitor destinations.
- Listen for clipping, pumping, noise, or tonal change; meters do not replace monitoring.
- Save the verified show state and note what requires rechecking at the venue.
| Handoff field | Record |
|---|---|
| Meter | Peak, true peak, RMS, average, VU, or loudness metric |
| Reference | dBFS, dBu, dBV, VU alignment, or manufacturer scale |
| Tap point | Exact point before or after processing, fader, and mute |
| Test source | Performer, playback file, tone, or program segment |
| Condition | Quiet, nominal, maximum, channel count, and routing state |
| Result | Observed margin, clip state, decision, and recheck trigger |
In Techrider.live, name the source and destination exactly as they appear in the stage plot and input list. Invite the responsible engineer to edit and save the same Rider, inspect history after routing or level ownership changes, and export a dated PDF for the venue.
FAQ
What is the difference between peak and RMS meters?
A peak meter emphasizes short maximum values, while an RMS-style meter averages signal over time to represent sustained energy more closely. Detection window, ballistics, calibration, and reference determine the exact reading.
Should you use peak or RMS metering for live sound?
Use both when available: peak information helps protect headroom, while RMS-style or average information helps judge sustained operating level. The correct display depends on the decision and the stage being measured.
What is crest factor in audio?
Crest factor is the difference between peak and average or RMS-style level when the references match. It describes how far transients rise above the sustained signal, not whether the audio is good or safe by itself.
Why do audio meters show different levels?
They may use different peak detection, averaging, ballistics, scales, references, calibration, or tap points. Two meters can both be correct while measuring different properties or different places in the signal path.
Does zero on a mixer meter mean clipping?
Not always. On a dBFS scale, zero is the digital ceiling, but analog, VU-style, and manufacturer-specific meters often place zero at a nominal reference with headroom above it. Check the console documentation.
Give every reading a reference
Build one current Rider with Techrider.live, record the source, destination, meter and tap point, and hand the next engineer a level plan they can reproduce instead of a number without context.
Last updated: 2026-09-21 · Reviewed for peak, RMS-style, crest-factor, meter-position, and technical-rider distinctions.
Related guides
What Is a Stage Plot? (And How to Read One)
A stage plot is a top-down map of your band's stage setup. Learn what goes on it, how it differs from an input list and tech rider, and what makes one engineer-readable.
6 min readBasicsWhat Is a Tech Rider? (Sections Explained)
A tech rider is the full technical package a band sends a venue — console, monitors, PA, backline, power, stage plot, input list, hospitality. Learn every section.
7 min readBasicsStage Plot Symbols & Legend Explained
A visual glossary of stage plot symbols — mics, DI boxes, wedges, IEM packs, drums, amps, keys, power drops. Learn what each icon means and how to read any stage plot.
7 min read