What Is a Stage Plot? (And How to Read One)
6 min read · Updated July 7, 2026 · new bands, venue techs
A stage plot is a top-down map of your band's stage setup. Learn what goes on it, how it differs from an input list and tech rider, and what makes one engineer-readable.
TL;DR — A stage plot is a top-down visual map of how your band, instruments, mics, and monitors are arranged on stage. Venues and sound engineers use it to prep the right gear and patch before you arrive. It's one part of a larger technical rider, usually paired with an input list.
What is a stage plot?
A stage plot is a bird's-eye-view diagram of your live setup. It shows where every person, instrument, microphone, DI box, monitor, and power drop sits on stage — so a venue or sound engineer can look at one picture and understand exactly how to build your show.
If a stage came with an instruction manual, the stage plot would be the picture on the cover. It answers one question above all: where does everything go?
The plot is almost always drawn from above, with stage left / stage right labeled from the performer's perspective facing the audience — not the audience's. (We break this down in Stage Left vs Stage Right.)
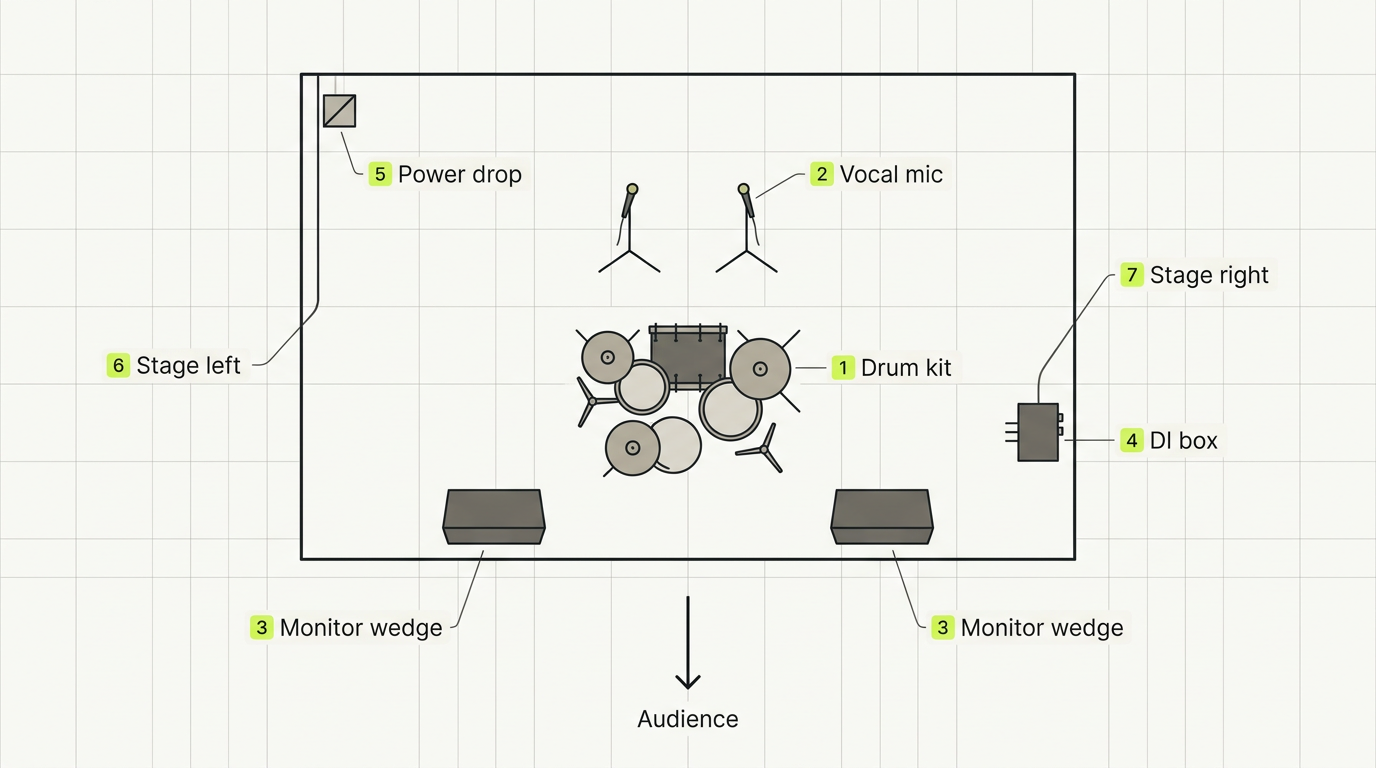 Fig. 1 — An annotated stage plot: positions, gear, monitors, power, and stage directions.
What goes on a stage plot?
A usable stage plot isn't art — it's a checklist drawn in space. Most include:
- Performers and their positions — where each musician stands or sits.
- Instruments and backline — drums, guitar amps, keyboards, risers.
- Microphones and DI boxes — every input source on stage, roughly where it lives.
- Monitors — wedge placements and IEM bodypack positions.
- Power drops — where you need AC, and roughly how many circuits.
- Stage directions and audience direction — so left/right is never ambiguous.
The golden rule: if the sound engineer needs to know it in order to patch or place something, it belongs on the plot.
Stage plot vs input list vs tech rider
These three get confused constantly. They're related but distinct:
- A technical rider is the whole package a band sends to a venue — PA and console needs, backline, power, hospitality, plus the stage plot and input list.
- A stage plot is the map — it says where things go.
- An input list is the channel-by-channel table — it says what each input is, how many channels, what mic/DI, and whether it needs phantom power.
Think of it like building a room: the rider is the full spec sheet, the stage plot is the floor plan, and the input list is the wiring diagram.
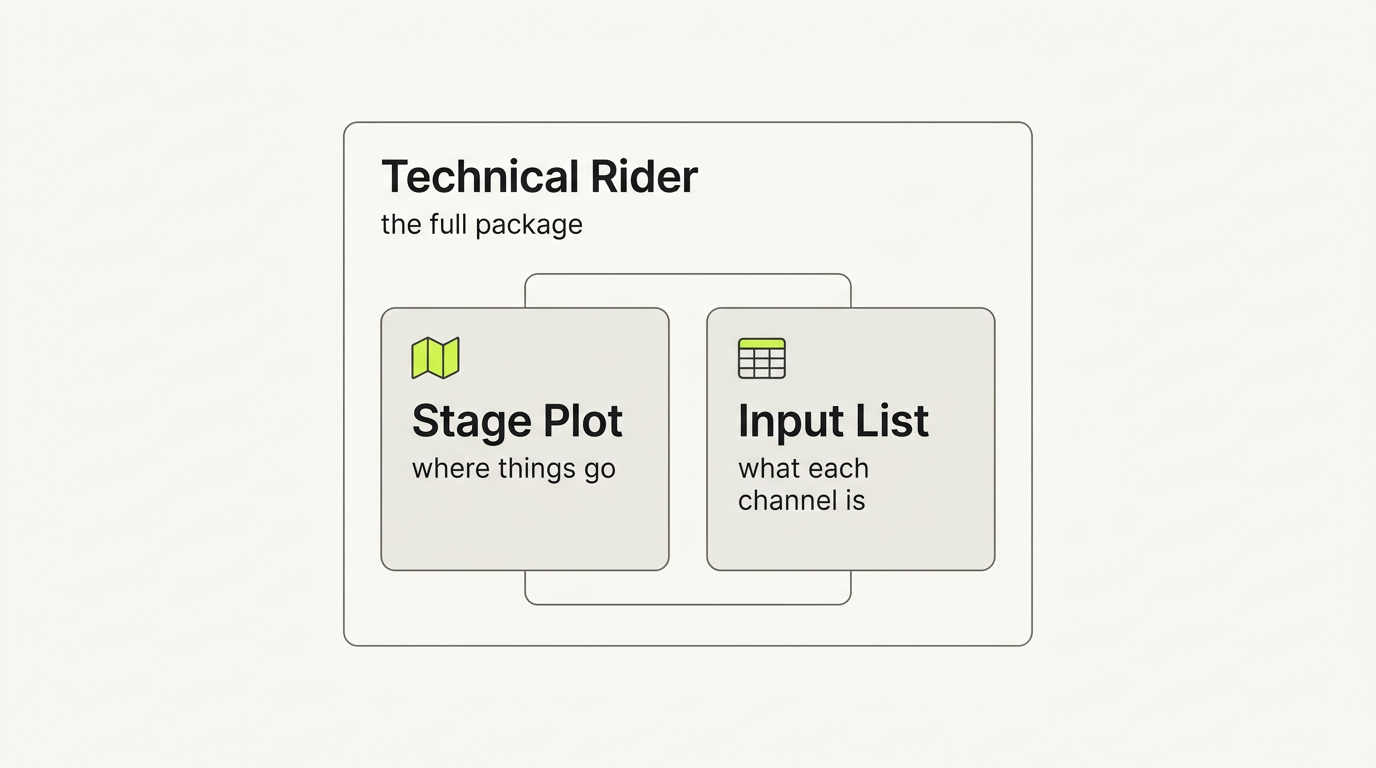 Fig. 2 — A stage plot and an input list are both parts of a technical rider.
→ Go deeper: What Is a Tech Rider? · How to Build an Input List
Why you need one
A clear stage plot pays off before you ever load in:
- Faster load-in and soundcheck. The crew can pre-run cable, place wedges, and stage backline before you arrive.
- Fewer day-of surprises. As one r/livesound engineer put it, "a proper stage plot with an input list may even cancel a need to talk to the venue in advance."
- You look professional. Venues take acts with clean documentation more seriously — and route them accordingly.
- Festivals require it. Multi-band changeovers run on tight schedules; a missing or vague plot is the bottleneck.
What makes a stage plot "engineer-readable"
Most bad stage plots fail the same way: they're drawn to look cool, not to be read under pressure. An engineer-readable plot is:
- Labeled clearly — every item has a name, not just an icon.
- Using a consistent legend — so a mic means a mic, everywhere. (Symbols & Legend Explained)
- Synced to the input list — channel numbers on the plot match the channel rows on the table. This is the single biggest source of day-of errors when they don't.
- Oriented correctly — stage directions from the performer's perspective.
- Exportable to PDF — festival networks are unreliable; a downloadable PDF is a safety belt, not a relic.
That last point — keeping the plot and its channel list as one connected data source, and exporting both a live link and a PDF — is a lot of what Techrider.live is built around.
Stage plot examples
Fig. 3 — A 4-piece rock band stage plot.
Fig. 4 — An acoustic duo plot.
Want to start from one of these? Grab a free stage plot template or build your own in five minutes.
FAQ
Is a stage plot the same as a tech rider? No. A stage plot is one part of a technical rider. The rider is the full package; the plot is just the stage map. (More on tech riders →)
What's the difference between a stage plot and an input list? The stage plot shows where things go on stage; the input list lists what each channel is and how it's patched. You need both. (More on input lists →)
Do I need a stage plot for a small gig? Yes. Even a 30-minute set at a small venue goes smoother when the engineer can pre-place your mics and wedges. A simple plot takes minutes and saves everyone time.
How do I make a stage plot? The fastest path is a purpose-built tool with a device library — see How to Make a Stage Plot for Your Band (5-minute guide).
What size or format should a stage plot be? Landscape, sized to fit A4/Letter, and exportable as PDF. A live link is great for collaboration and keeping the latest version; a PDF is essential for the day of show.
What's next
- 📌 Make your first stage plot in 5 minutes
- 📋 Download a free stage plot template
- 📄 Understand the full technical rider
Further reading
- Stage Plot For Bands, with Examples — DIY Musician (CD Baby)
- Understanding Stage Plot & Input List — NLFX Pro
- Stage Plot — Crescat Glossary
Last updated: 2026-07-07 · Reviewed by the Techrider.live team · Tested against real festival and club stage plots.
Related guides
What Is a Tech Rider? (Sections Explained)
A tech rider is the full technical package a band sends a venue — console, monitors, PA, backline, power, stage plot, input list, hospitality. Learn every section.
7 min readBasicsStage Plot Symbols & Legend Explained
A visual glossary of stage plot symbols — mics, DI boxes, wedges, IEM packs, drums, amps, keys, power drops. Learn what each icon means and how to read any stage plot.
7 min readBasicsStage Left vs Stage Right (and Stage Directions Explained)
Stage left and stage right are from the performer's perspective facing the audience — which is the mirror of what the audience sees. A clear, memorable explainer of stage directions, house left/right, and upstage/downstage.
7 min read