How to Make a Stage Plot for Your Band (5-Minute Guide)
9 min read · Updated July 7, 2026 · new bands
A 5-step walkthrough to make a clean, engineer-readable stage plot for your band — set the stage, place performers, add gear and mics, then export a PDF and share link.
TL;DR — To make a stage plot, set the stage dimensions, place each performer (stage left/right from the performer's perspective), drop in instruments and backline, add mics/DIs and monitors, then label everything and export a PDF. In Techrider.live, the channel numbers on your plot stay synced to your input list automatically — what you draw is what the engineer gets.
A stage plot is just a top-down map of where everything goes on stage, and a clean one takes about five minutes once you know the order of operations. This walkthrough uses Techrider.live, but the same five steps apply in any tool. If you want the concept first, read What Is a Stage Plot?.
Table of contents
- Step 1: Create a Rider and set the stage
- Step 2: Place your performers
- Step 3: Add instruments and backline
- Step 4: Add mics, DIs, and monitors
- Step 5: Label, check, and export
- Tips for a clean plot
- FAQ
Step 1: Create a Rider and set the stage
Start by creating a new Rider — in Techrider.live, a Rider is the reusable container that holds your stage plot, input list, monitor mixes, and notes as one connected document. Open it and switch to the Stage Plot view.
Before placing anything, set the stage dimensions: how wide and deep your stage is, and where the audience sits. This sets the grid everything else snaps to, and tells the venue engineer how much real estate you're working with. Mark the downstage edge (closest to the audience) so orientation is unambiguous.
Fig. 1 — A new Rider with the stage plot canvas sized and oriented.
Step 2: Place your performers
Place each person on stage, roughly where they'll stand or sit. This is the spine of your plot — once bodies are placed, every instrument, mic, and monitor is positioned relative to them.
Here's the part that trips up every first-timer: stage left and stage right are labeled from the performer's perspective, facing the audience — not the audience's. When you stand on stage looking out, your left hand is stage left. From the audience's seat, it's flipped. (Full breakdown: Stage Left vs Stage Right.) A typical 4-piece rock band lays out like this:
- Drummer — downstage center, on a riser.
- Lead vocalist / rhythm guitar — center or stage right.
- Bass — stage left.
- Lead guitar — stage right.
Fig. 2 — Performers placed, with stage directions oriented correctly.
Step 3: Add instruments and backline
With people placed, drop in the gear each person plays: amps, keyboards, drum kit, risers, and shared backline. Place each item next to (or behind) the performer who uses it.
The fastest path for drummers: the drum-kit rig preset drops a fully-labeled kit (kick, snare, toms, cymbals, stands) in one click, tunable afterward. For everyone else, drag in guitar and bass amps, keyboard rigs, and acoustic instruments.
Skip the mics for now — that's the next step. Right now you're laying down the physical footprint.
downstage-center, a guitar amp stage right near the lead guitarist, a bass rig stage left, and a keyboard upstage right. Neutral UI, items snapped to the grid.) Fig. 3 — Backline and the drum-kit rig preset in place.
Step 4: Add mics, DIs, and monitors
This is where a stage plot earns its keep. Every input source needs a mic or DI box; every performer who needs to hear themselves needs a monitor (wedge or IEM bodypack). Place each one near the source it serves.
Why this matters more than people expect: each mic or DI on the plot becomes a channel on your input list. In Techrider.live the two are one data model — drop a vocal mic on stage and a numbered channel row appears; rename it and both update. That single-source behavior kills the classic day-of error where the channel numbers on the drawing don't match the table.
What to add:
- Vocal mics — one per singer, on a stand.
- Instrument mics — for cabs, drum overheads, snare, kick.
- DI boxes — for acoustic guitar, keys, bass DI.
- Monitors — wedges along the downstage edge, or IEM bodypacks near each performer.
- Power drops — roughly where you need AC, if relevant.
matching rows in a side panel input list. The two stay in sync visibly. Neutral UI.) Fig. 4 — Mics, DIs, and monitors placed; channel badges reflect the input list.
→ Need to go deep on the table itself? See How to Build an Input List / Patch Sheet.
Step 5: Label, check, and export
Now make the plot engineer-readable:
- Label everything. Every item gets a name, not just an icon — "Kick," "Vocal 1," "Bass DI," "Wedge — drummer." An engineer scanning under load needs words.
- Run the missing-info check. Techrider.live scans your Rider for gaps — an unlabeled mic, a channel with no name, a missing monitor — and flags them before they become a day-of phone call.
- Export the PDF. Festival networks fail, phones die, emails get buried. A downloadable PDF is your safety belt.
- Copy the share link. This is the live, view-only link to the current Rider. Email it to the venue, the engineer, or your tour manager.
, and an export bar offering PDF download and a copyable share link. Neutral UI, acid-green accents on the action buttons.) Fig. 5 — Final plot, checked, with PDF and share-link export ready.
Bring in your engineer or TM
You don't have to be the only one who can update it. Invite up to three collaborators by email to open, edit, save, export, and inspect the history of the same Rider. This is multi-editor collaboration — you work, save, and hand off; your engineer or TM picks it up and refines. (Real-time simultaneous editing with live presence is on the roadmap, not shipping today.) The vocalist draws positions, the drummer confirms the kit, the engineer fills in mic choices and patch — each in turn, on one document, without emailing PDFs back and forth.
Tips for a clean plot
- Draw from above, always. Top-down is what engineers expect; 3D views read slower under pressure.
- Stage left/right from the performer's perspective. The most common beginner mistake. Stand on stage and look out.
- One label per item. If a mic is unlabeled, the engineer guesses. Don't make them guess.
- Keep the plot and the input list together. Channel numbers on the drawing must match the rows on the table — the biggest day-of error source, and what single-source tools prevent.
- Mark the audience direction. A single arrow on the downstage edge removes all ambiguity.
- Re-export the PDF after material changes. The live link is the source of truth; a freshly dated PDF is what gets printed at load-in.
- Less is more. A clean plot with 12 well-labeled items beats a busy one with 30 half-labeled shapes.
Want to skip the blank-canvas step? Grab a free stage plot template and customize from there.
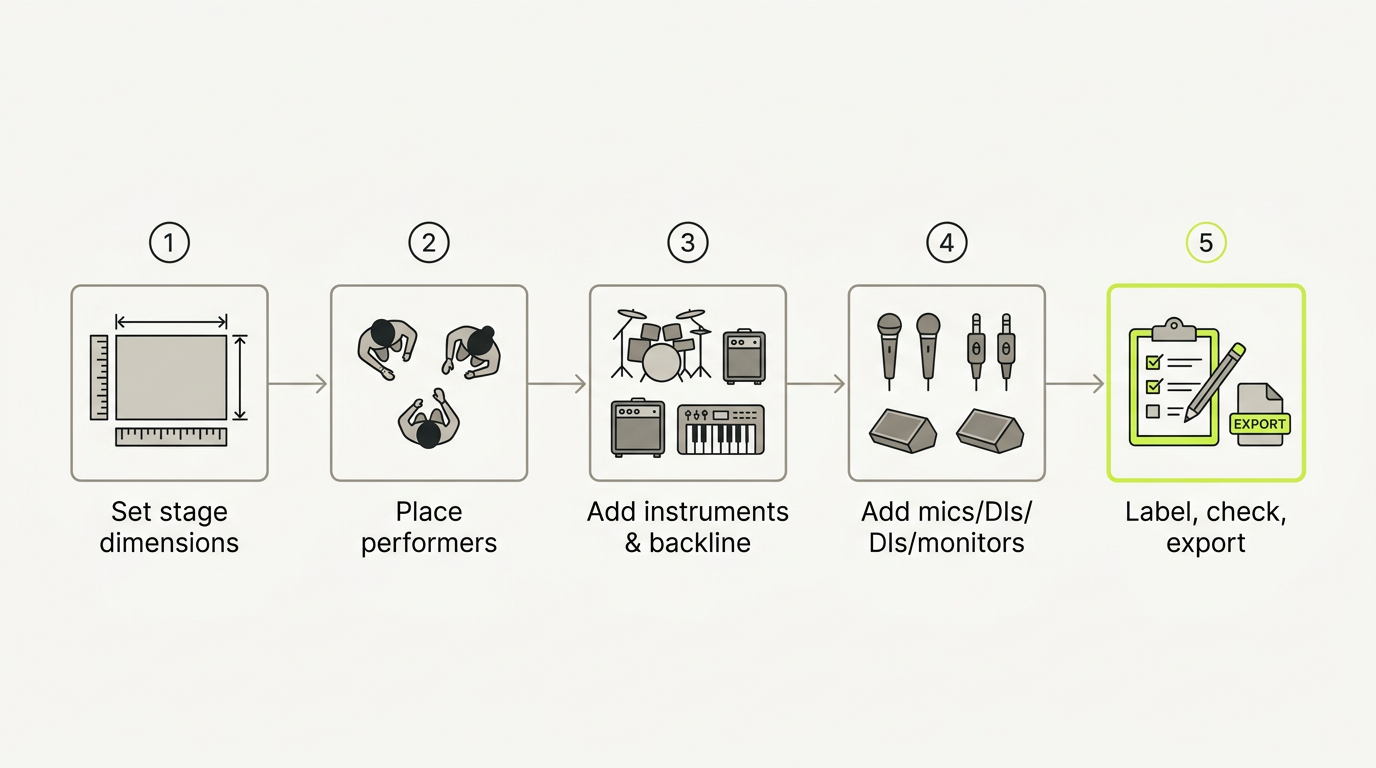 Fig. 6 — The five steps, end to end.
FAQ
What should be included in a stage plot? Performers and their positions, instruments and backline, every mic and DI box, monitors (wedges or IEMs), power drops, and clear stage directions. If the engineer needs it to patch or place something, it belongs on the plot. (What goes on a stage plot →)
How do you draw a stage plot from above? Picture yourself floating directly above the stage looking down. The audience is at the bottom (downstage edge); upstage is at the top. Place performers, gear, and mics in their real-world positions. Top-down is the convention — resist the urge to draw a 3D or front-on view.
Is stage left from the performer's or the audience's perspective? The performer's perspective, facing the audience. Your left hand is stage left. From the audience's seat, it's flipped — label it explicitly. (Stage Left vs Stage Right →)
What is the best free stage plot maker? For a clean, reusable plot that keeps the stage layout and input list in sync — and exports both a PDF and a shareable link — purpose-built tools beat generic drawing apps. See our free stage plot template guide and the best stage plot software comparison. (Verification note: tool landscape changes fast — confirm current free-tier limits before publishing.)
Do I need a stage plot for a small gig? Yes. Even a 30-minute set at a small venue runs smoother when the engineer can pre-place mics and wedges. A simple plot with five labeled inputs takes minutes and saves soundcheck time.
What's next
- 📋 Download a free stage plot template
- 📄 Build an input list / patch sheet
- 🧭 Understand the full technical rider
Further reading
- Stage Plot For Bands, with Examples — DIY Musician (CD Baby)
- How to Make a Stage Plot and Input List — Tour Manager Info
- Best free software or website to make a simple stage plot — r/livesound
Last updated: 2026-07-07 · Reviewed by the Techrider.live team · Tested against real festival and club stage plots.
Related guides
Free Stage Plot Template (Download + How to Use)
A stage plot template is a pre-laid-out starting point for your band's stage map. Pick one of four shapes, customize performers and gear, and export a PDF.
9 min readTutorialsHow to Build an Input List / Patch Sheet (with Template)
A channel-by-channel table of every source on stage. Learn the input list columns, the drums-to-vocals ordering, 48V and DI rules, and how a patch sheet differs.
7 min readTutorialsCollaborating on a Rider: Invite Your Engineer or TM
Invite up to 3 collaborators to edit the same tech rider on Techrider.live. Learn multi-editor, asynchronous collaboration: invite by email, co-edit, inspect history, share a view-only link, and export PDF.
7 min read